You're ready for your product's launch, you'd like to show your customers finally there's a solution for their pain. You expect 1000 people using your service per hour, you made all the calculations and somehow you're confident. But, are you? Load Testing is here to simulate the traffic, 1000 people using your service per hour, and increase your confidence on launch day(and after).
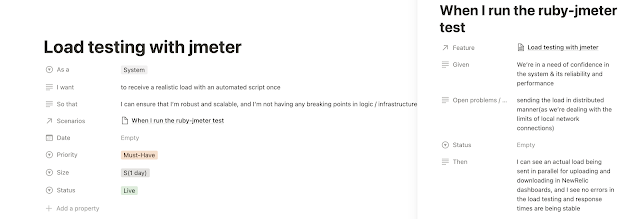
The story for FolderCode, a temporary file uploading service, was exactly like above, and just to show how it was addressed in its backlog, see the picture below.
Designing your JMeter Test Plan
JMeter is a well-known tool for load or stress testing, it basically sends requests to your application within the given time, according to the behaviour plan you provided. The plans are designed to be detailedly configurable and focused on load-testing jargon. That makes the JMeter a comprehensive solution, however makes it a bit hard to understand & focus on the well written tests.
Here comes the
ruby-jmeter! An easy to use tool that helps you to write readable test plans, which leads to focusing on your simulator scenarios to become closer to real customer behaviours. Under the hood, it uses JMeter. The code below simulates 10 customers keep visiting Google while its being run.
Preparing our Dashboards to observe our Product's behaviour
Before we start sending some traffic to simulate the launch day, do you already monitor your system? If not, you should! Some basic things like traffic, CPU, memory, and also some functional metrics, for example our case was how many files are being uploaded. Create a dashboard where you can easily watch the vital signs of your system.
You'll find so many things that weren't ready in your dashboard as you were focusing on the developing particular features not overall system's behaviour. This is actually a great benefit of preparing for a load testing.
You should design some alerts for non-desired values such as storage usage should never reach to 70%.
Let's send some traffic!!
That's the most fun part, sending the traffic with using JMeter and watching the vitals of our system. It's as exciting as the product launch, if not more. While the script is being run, for 2 minutes as configured, you can watch the metrics are changing on your dashboard.
Analyzing the results
Did you have receive any errors during the simulation?
Customers' latency was increasing? Increased latency gives worse customer experience.
Did any request fail?
Did you find any additional vital sign that should be monitored?
Do you need to make some infrastructure modifications?
Are you now confident that your system can handle the pre-calculated load without any increased latency?
Show your team your results! I was so happy to see that uploading ~1000 files in 2 minutes caused no issue to our system. Now you should have a validated confidence over your system. Make sure that you save your JMeter code in you repositories for reuse and improving the test plan!
You can run the load tests periodically to stay confident over your system especially for the critical parts.
Reference links
https://www.blazemeter.com/blog/jmeter-performance-testing
https://www.blazemeter.com/blog/performance-testing-vs-load-testing-vs-stress-testing


